By Yuri Kudryavcev, Principal Consultant, Cornerstone Performance Management
I was just reading through Price Volume Mix analysis IBM Accelerator template and it would have been be so useful for me about 5 years back when I had to create our own template for a pharmaceutical model. Here’s some of my ramblings about it.
What is Price Volume Mix?
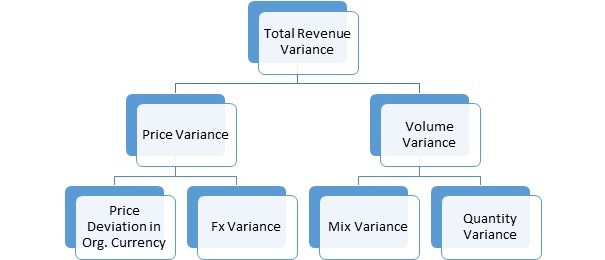
Price volume variance is a standard analysis for so called ‘widget’ companies (selling products as opposed to services), you’d see it often in FMCG, pharma, consumer product companies. It’s goal is to break down the sales variance between different scenarios and attribute the difference to:
volume : are we selling more or less
price : are we charging more or less
currency impact: we’re doing all the same, but FX change
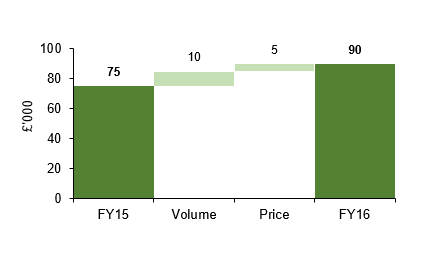
Visually you’d want to build a ‘bridge’ between 2 scenarios attributing the variance, like this:
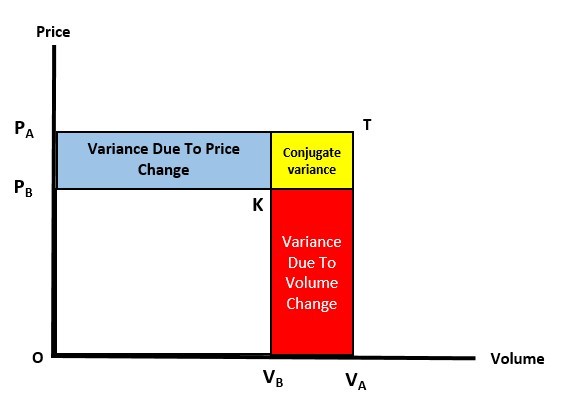
that shows that the difference between FY15 and FY16 of 15k is split 10 / 5 between volume and price, so we’re getting 10k more cause we’re selling more and 5k more cause we’re charging more. Or like this if you’re into multiple axises charts:
Considerations for implementation
The IBM template includes so many important things from the get go:
Selecting the level of product (or any dimension for that matter) to calculate on, i.e. you can have an impact on a particular SKU, but not the product line itself
Having COGS as well as Gross Sales & Net Sales is very beneficial for end to end analysis. Be careful with Gross Margin effects though, they quickly become very tricky to calculate correctly.
Currency impacts and restatements – you need to think this one through and through, I’m not 100% sold on 2 currency dims in the template (I used 1), but comparable rates are a must.
There’s a few other ‘talking points’ I’d add:
Always think about adding more accounts to ‘drill down’ in the analysis, i.e. have price moved because we’re giving more rebates or volume discounts? I try to add the whole Gross Sales to Margin revenue account structure ‘just in case’
adding a repackaging / ‘creating a comparable’ product functionality that allows you to ‘restate’ the various scenarios to a similar product mix. Replacing a product with a new version of the same product (or a different packaging in pharma) would look like a massive volume impact on the old product, but it’s not necessarily the case. Pharma’s approach at some point is to go to things like ‘per mg of active ingredient / doses / vials’ comparisons
I would avoid doing it in the same part of the model as the other calculations on any decent sized model, a separate reporting cube populated by TIs is the way to go. This analysis requires a lot of C level rules that are caching & performance killers.
unsurprisingly we couldn’t standardise this calculation even for different country branches of the same company and it’s still a hard thing starting from a template model, C-level rules will do your head in
We use cookies on our website to give you the most relevant experience by remembering your preferences and repeat visits. By clicking “Accept All”, you consent to the use of ALL the cookies. However, you may visit "Cookie Settings" to provide a controlled consent.
This website uses cookies to improve your experience while you navigate through the website. Out of these, the cookies that are categorized as necessary are stored on your browser as they are essential for the working of basic functionalities of the website. We also use third-party cookies that help us analyze and understand how you use this website. These cookies will be stored in your browser only with your consent. You also have the option to opt-out of these cookies. But opting out of some of these cookies may affect your browsing experience.
Talk to us
To find out more about Anaplan solutions for your business, please complete the form below and our team will respond within 1-2 business days
Click edit button to change this text. Lorem ipsum dolor sit amet, consectetur adipiscing elit. Ut elit tellus, luctus nec ullamcorper mattis, pulvinar dapibus leo.